How SAT Scoring Works (and What a Good Score Is)
Where that all-important number comes from.
How does SAT scoring work? What is the maximum score possible?
The test is scored out of 1600. That total is simply the sum of your two section scores, Reading & Writing and Math, each of which runs from 200 to 800. Post an 800 on both and you’ve got yourself a perfect 1600. That, of course, is easier said than done…
How do raw points convert to a scaled score?
Getting from the questions you answer to that 200–800 figure takes two steps:
- First is your raw score, which is just the number of questions you got right. And here’s a rule worth remembering: there’s no penalty for wrong answers on the SAT, so a blank and a wrong guess cost you precisely the same.
- That raw score is then converted to the scaled 200–800 score through a process called equating, which irons out tiny differences in difficulty between test versions so that a 700 in March means the same thing as a 700 in October.
How does section-adaptive testing work? What is the difference between Module 1 and Module 2?
The digital SAT is section-adaptive. Each of the two sections is delivered in two modules. Everyone sees a first module of mixed difficulty, and how you perform on it decides which second module you get, an easier one or a harder one (see the chart below).
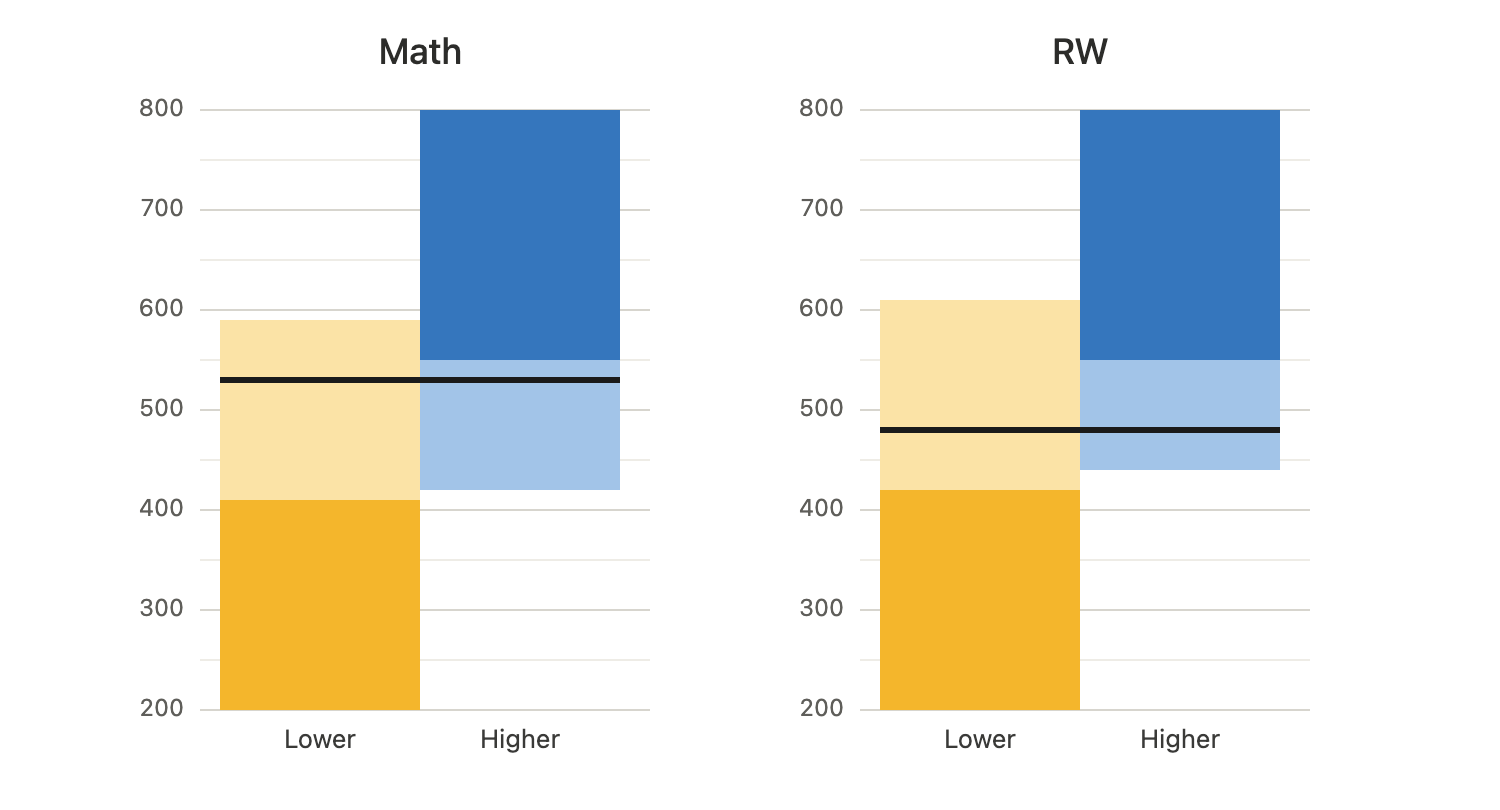
The harder second module is what unlocks the top of the scoring range, so the first module of each section carries the most weight. In practice, that means you can’t coast through the opening questions assuming you’ll make it all up later, as you’ll max out at ~600. Treat the first module of each section as the one that sets your ceiling, because that’s exactly what it does.
How does my SAT score compare to an ACT score?
If you’re weighing the SAT against the ACT, the two are directly comparable through an official concordance. College Board and ACT jointly publish a table that maps one onto the other. A rough version looks like this:
| SAT (out of 1600) | ACT (out of 36) |
|---|---|
| 1600 | 36 |
| 1360 | 30 |
| 1200 | 25 |
| 1030 | 20 |
| 900 | 16 |
These are approximate anchor points; for an exact conversion, use the official concordance tables. The practical takeaway is that you almost never need to sit both tests. Pick whichever one suits you, convert the score if a college asks, and pour your energy into that single test.
What’s a good SAT score?
The honest answer is that it depends entirely on where you’re trying to go. In absolute terms, the national average hovers a little above 1000, so anything meaningfully north of that already puts you ahead of most test-takers. Push into the 1200s and you’re roughly in the top quarter; a 1350 or so lands you near the top 10%; and the low 1500s and up puts you in the top couple of percent, which is the territory the most selective schools expect. That average drifts a bit year to year, so treat these figures as landmarks, not hard lines.
| SAT Score | Approx. Percentile |
|---|---|
| 1020–1050 | ~50th (average) |
| 1200+ | ~75th |
| 1350+ | ~90th |
| 1500+ | ~99th |
So what score do I need to get into my dream school?
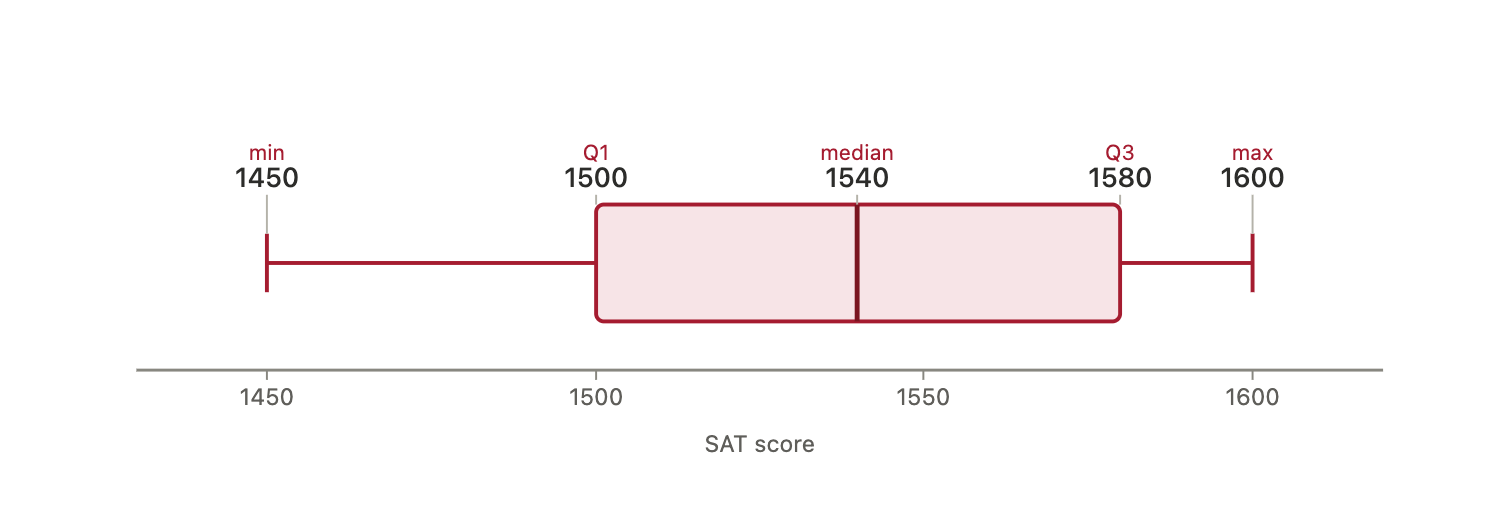
There’s no universal cutoff. Instead, treat the 75th percentile of your dream school’s admitted class as your target and its 25th percentile as your floor (see the Harvard example below), and keep in mind that the score is only one ingredient in the application. A big number won’t rescue a weak transcript, but it can absolutely tip a borderline decision your way, which is exactly why it’s worth preparing properly with platforms like Kinnu rather than leaving it to chance.
No really, what score do I need to get into my dream school?
Alright alright, we’ve compiled a non-exhaustive list of many people’s dream schools:
| School | SAT (mid 50%) | Acceptance rate |
|---|---|---|
| Arizona State | 1100–1320 | ~90% |
| University of Alabama | ~1180–1360 | ~78% |
| Texas A&M | 1160–1390 | ~57% |
| Ohio State | 1280–1430 | ~45% |
| Georgia Tech | 1390–1540 | ~14% |
| Emory | 1420–1540 | ~11% |
| Cornell | 1430–1550 | ~8% |
| Dartmouth | 1440–1560 | ~5% |
| Brown | 1440–1570 | ~5% |
| Columbia | 1450–1570 | ~4% |
| Penn | 1460–1570 | ~5.5% |
| Princeton | 1460–1570 | ~4.6% |
| Yale | 1470–1580 | ~3.7% |
| Harvard | 1500–1580 | ~3.5% |
| Stanford | 1500–1580 | ~3.6% |
| Duke | 1500–1570 | ~6% |
| UChicago | 1510–1570 | ~5% |
| Johns Hopkins | 1500–1570 | ~7% |
| MIT | 1530–1580 | ~4% |
| Caltech | ~1530–1580 | ~3% |
What is superscoring, and how does it change my strategy?
Superscoring means a college takes your single best Reading & Writing score and your single best Math score across all the sittings you send them, even if those two bests came from different test dates, rather than just looking at your highest one-day total. Say you score 700 Reading & Writing / 650 Math in the fall, then 660 Reading & Writing / 720 Math in the spring — a school that superscores would credit you with 700 + 720 = 1420, better than either individual sitting. Most selective colleges superscore the SAT, but policy varies school to school, so check each target school’s stated policy rather than assuming.
This changes the retake calculus: if one section is already strong and the other is dragging your total down, superscoring means a retake focused on shoring up just that weaker section can be worth more than grinding for a marginal gain across both. It’s also part of why Score Choice, sending only your best sitting(s) rather than every score you’ve ever gotten, pairs so naturally with superscoring: between the two, a rough first attempt is rarely something you need to worry colleges will hold against you.
Start your 7-day free trial now
No credit card required
Get instant access
Start learning now
- Full access to all Questions
- Full access to all Study Notes
- Full access to all Flashcards
- Full access to Practice Exams
- Lara AI tutor
- Prep Score & performance analysis
- Desktop & Mobile app